
See emerging safety signals sooner, and act on evidence
Nirnāśā Signal Detection Management runs proven statistical methods over FAERS and your other data sources. It ranks every signal with a priority score you can see into, and takes each one through a governed GVP Module IX lifecycle, from detection to a monitored risk action.
The statistics regulators know, in one engine
From classic disproportionality to Bayesian shrinkage and sequential surveillance, you can use the method that suits the question and show your working.
Proportional Reporting Ratio
How often an event is reported with a drug, compared with all other drugs, with a 95% confidence interval.
Reporting Odds Ratio
The odds of the drug–event pair against the background, with a 95% CI. A lower bound above 1.0 flags a signal.
Information Component
A Bayesian measure in the WHO VigiBase style that stays stable when case counts are small.
Empirical Bayes (MGPS)
EBGM and EB05 from a DuMouchel multi-item gamma Poisson shrinker, to reduce false positives.
Hierarchical scan
Looks for signals across the MedDRA hierarchy (SOC → HLGT → HLT → PT), so related terms that are each too weak on their own still surface together.
Sequential testing
Maximised sequential probability ratio testing to catch reporting that is speeding up over time, as FDA Sentinel does.
Poisson CUSUM
Cumulative-sum surveillance that alerts when reporting of a drug–event pair shifts upward.
FAERS analysis in a few clicks
Query the FDA Adverse Event Reporting System through openFDA for any drug and up to five events, or screen hundreds of pairs in one bulk run.
- Drug + event dashboard. PRR and ROR with 95% CI, top 10 suspect drugs and co-reported events.
- Demographics. Distributions by sex, age, reporter type and country.
- Bulk detection. Up to 500 pairs for a single drug or event, filtered to ROR lower 95% CI > 1.0 and sortable by cases, PRR or ROR.
- Reliable at scale. Rate limiting with automatic back-off keeps long scans running.
- Exports. CSV line listings and full-page PDF.
5 events selectedQuery run
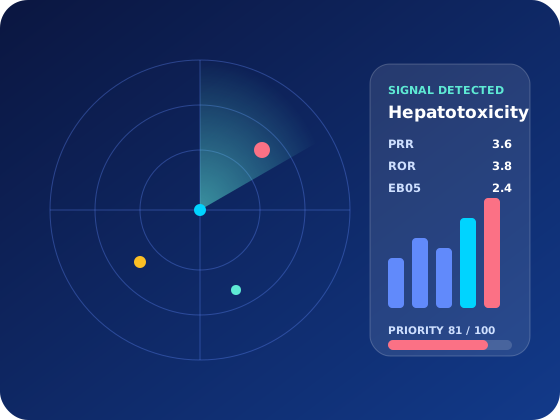
PRR 3.6 · ROR 3.8 (2.9–5.0)Signal
ROR 1.1 (0.9–1.3)No signal
62% female · median 54 yProfile
CSV · PDFExported
Evidence-led signal management, with the discipline regulators expect.
See where your sources agree
In line with EU Implementing Regulation 2025/1466, signals are checked across all the data you hold. For each drug–event pair you see how many sources agree, which source flagged it first, and a combined EB05.
- FAERS via openFDA, connected live.
- EudraVigilance (EVDAS), VigiBase and FDA Sentinel, connected with your organisation's credentials.
- VAERS and Embase through file import.
- Your own case data and literature, including live PubMed search with built-in PV filters.
A priority score you can explain to an inspector
Every signal gets a score from 0 to 100, built from weighted, published factors. You can see exactly how much each factor added, and a reviewer can override the result with a recorded reason.
Human override available · reason and user recorded
A governed path for every signal
Signals move forward one stage at a time, and gates stop a signal closing without evidence. Every move back needs a reason, and every transition is audited.
- Detected
- Triage
- Validation
- Confirmation
- Prioritisation
- Assessment
- Recommendation
- Risk action
- Effectiveness
- Closed
Signal committee
Meetings with quorum rules, recorded votes and automatically generated minutes.
Risk actions
Label updates, communications and other measures recorded against the signal.
Effectiveness gate
A signal can't close until the effectiveness of its risk action has been assessed.
Watchlists
Watchlisted pairs are re-checked automatically as new data arrives.
Seven specialised agents, one reviewer in charge
The AI triage copilot drafts an assessment based only on the signal's own metrics, with citations and a capped confidence score. A person must confirm it, and every triage is audited. Without an AI key, a rules-based version keeps working offline.
Ingestion
FAERS/openFDA, EHR extracts, PubMed and manual entry.
Detection
PRR, ROR and IC runs, including rate-limited bulk scans.
Causality
Scoring against the WHO-UMC criteria.
Lifecycle
Stage management with EMA-aligned gates.
Reporting
PRAC summaries, PSUR/PBRER signal sections and line listings.
Demographics
Breakdowns by sex, age, reporter and country.
Normalisation
NLP entity extraction and de-duplication.
Orchestration
Run agents one at a time, as a pipeline or in parallel.
Every decision signed and traceable
EMA GVP Module IX
A signal management lifecycle with stage gates and documented decisions.
EU IR 2025/1466
Evidence across all available data sources, with concordance shown.
21 CFR Part 11
Password re-entry to validate, close, escalate or reject a signal.
Hash-chained audit trail
A tamper-evident record of every metric run, transition and override.
An AI copilot for signal triage
The triage copilot drafts an assessment from the signal’s own metrics, with citations and a capped confidence score. A reviewer confirms every triage.
AI triage copilot
Draft assessments grounded only in the signal’s metrics, with citations.
Seven specialised agents
Intake, detection, causality, lifecycle, reporting, demographics and normalisation.
Flexible orchestration
Agents run one at a time, as a pipeline or in parallel.
Works offline too
Without an AI key, a rules-based version keeps triage running.
Explore the connected suite
Find the signal before it finds you
See disproportionality, TreeScan and the GVP IX lifecycle running on live FAERS data for your products.